Observability data provides near real-time insights into the health and performance of AWS workloads, so that engineers can quickly address production issues and troubleshoot them before widespread customer impact.
As AWS workloads grow, observability data has been exploding, which requires flexible big data solutions to handle the throughput of large and unpredictable volumes of observability data.
Solution overview
One option is Amazon Kinesis Data Firehose, which is a popular service for streaming huge volumes of AWS data for storage and analytics. By pulling data from Amazon CloudWatch, Amazon Kinesis Data Firehose can deliver data to observability solutions.
Among these observability solutions is Logz.io, which can now ingest metric data from Amazon Kinesis Data Firehose and make it easier to get metrics from your AWS account to your Logz.io account for analysis, alerting, and correlation with logs and traces.
In a few clicks and a few configurations, we’ll see how you can start streaming your metric data (and soon, log data!) to Logz.io for storage and analysis.
Prerequisites
- Logz.io account – Create a free trial here
- Logz.io shipping token – Learn about metrics tokens here. You need to be a Logz.io administrator.
- Access to Amazon CloudWatch and Amazon Kinesis Data Firehose with the appropriate permissions to manage HTTP endpoints.
- Appropriate permissions to create an Amazon Simple Storage Service (Amazon S3) bucket
Sending Amazon CloudWatch metric data to Logz.io with an Amazon Kinesis Data Firehose
Amazon Kinesis Data Firehose is a service for ingesting, processing, and loading data from large, distributed sources such as logs or clickstreams into multiple consumers for storage and real-time analytics. Kinesis Data Firehose supports more than 50 sources and destinations as of today. This integration can be set up in minutes without a single line of code and enables near real-time analytics for observability data generated by AWS services by using Amazon CloudWatch, Amazon Kinesis Data Firehose, and Logz.io.
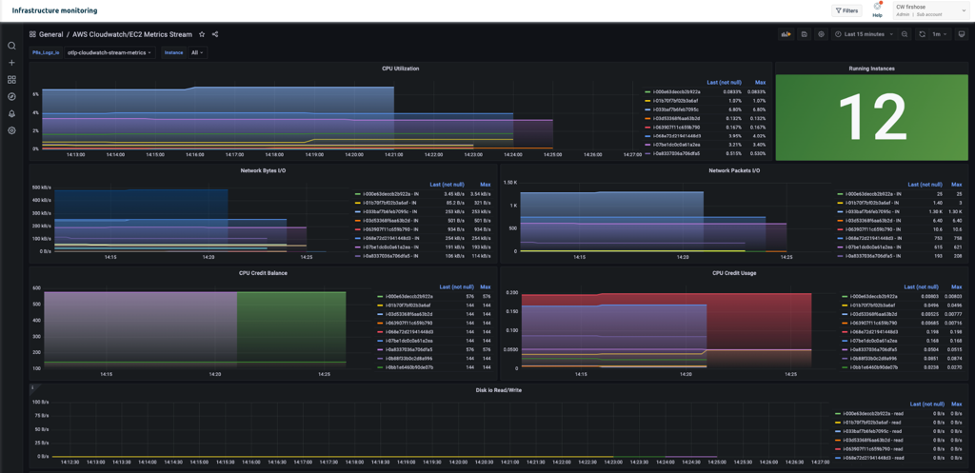
Once the integration is configured, Logz.io customers can open the Infrastructure Monitoring product to see their data coming in and populating their dashboards. To see some of the data analytics and correlation you get with Logz.io, check out this short demonstration.
Let’s begin a step-by-step tutorial for setting up the integration.
- Start by going to Amazon Kinesis Data Firehose and creating a delivery stream with Data Firehose.

- Next you select a source and destination. Select Direct Put as the source and Logz.io the destination.
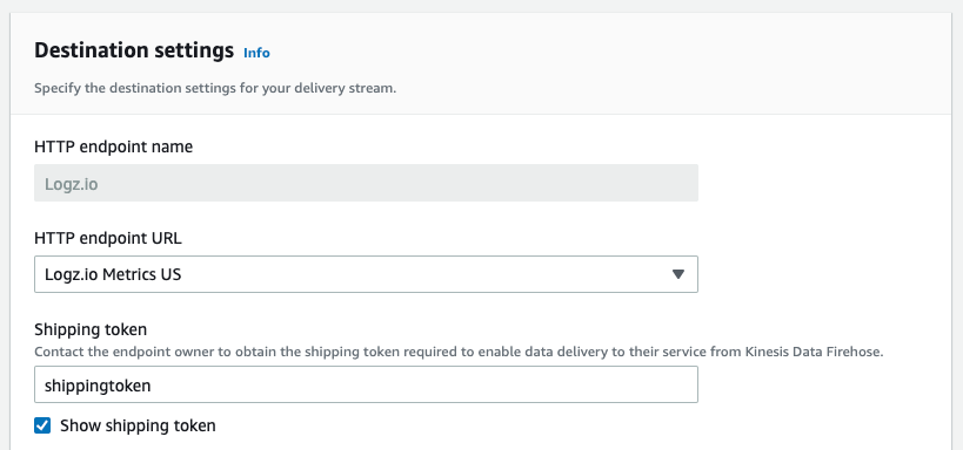
- Next, configure the destination settings. Give the HTTP endpoint a name, which should include logz.io.
- Select from the dropdown the appropriate endpoint you would like to use.
If you’re sending data to a European region, then set it to Logz.io Metrics EU. Or you can use the us-east-1 destination by selecting Logz.io Metrics US.
- Next, add your Logz.io Shipping Token. You can find this by going to Settings in Logz.io and selecting Manage Tokens, which requires Logz.io administrator to access. This ensures that your account is only ingesting data from the defined sources (e.g., this Amazon Kinesis Data Firehose delivery stream).

Keep Content encoding on Disabled and set your desired Retry Duration.
You can also configure Buffer hints to your preferences.
- Next, determine your Backup settings in case something goes wrong. In most cases, it’s only necessary to back up the failed data. Simply choose an Amazon S3 bucket or create a new one to store data if it doesn’t make it to Logz.io. Then, select Create a delivery stream.
Now it’s time to connect Amazon CloudWatch to our Amazon Kinesis Data Firehose Delivery Stream.
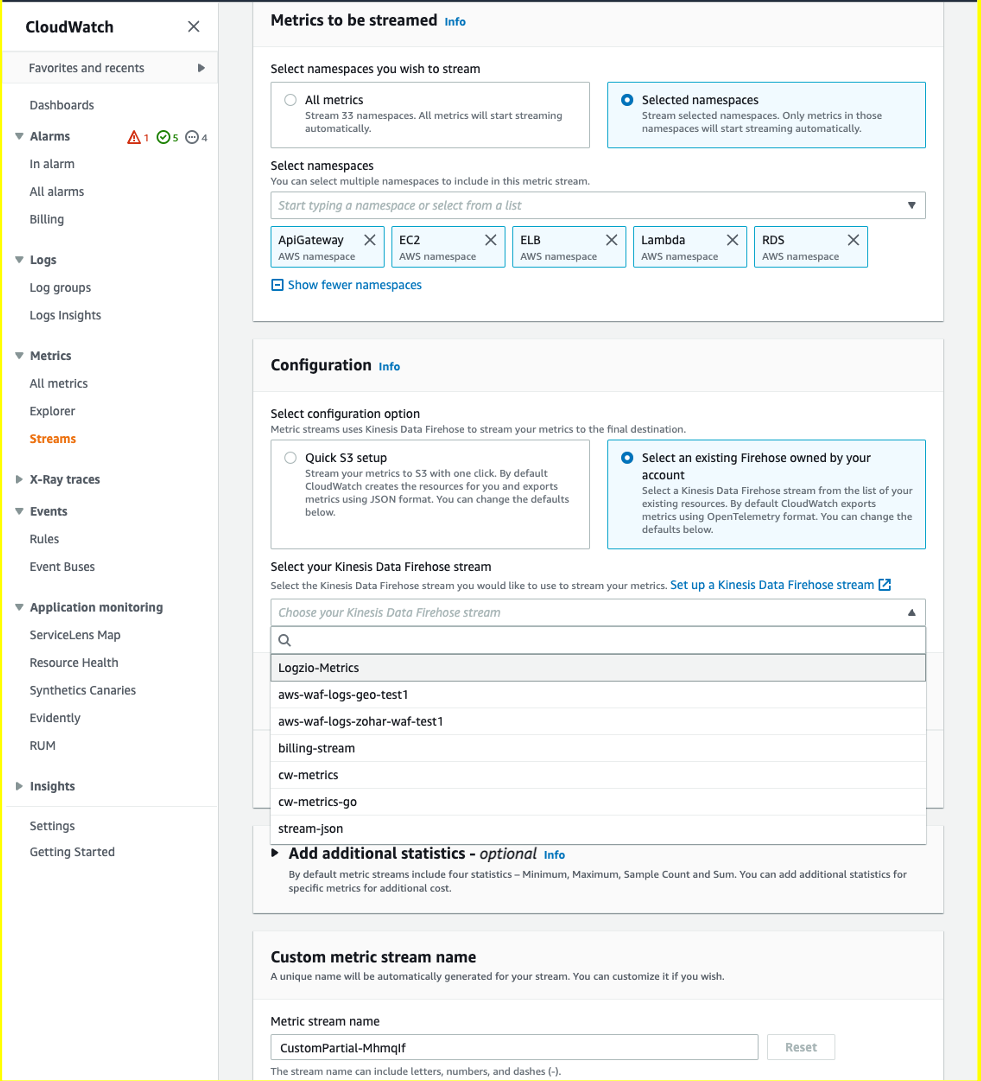
- Navigate to Amazon CloudWatch and select Streams in the Metrics menu. Select Create metrics stream.
- Next, you can either select to send all your Amazon CloudWatch metrics to Logz.io, or only metrics from specified namespaces.
In this case, we chose Amazon Elastic Compute Cloud (Amazon EC2), Amazon Relational Database Service (Amazon RDS), AWS Lambda, and Elastic Load Balancing (ELB).
- Under Configuration, choose the Select an existing Firehose owned by your account option and choose the Amazon Kinesis Data Firehose you just configured.

If you’d like, you can choose additional statistics in the Add additional statistics box, which provides helpful metrics in terms of percentiles to monitor like latency metrics (i.e., which services have the highest average latency). This may increase your costs.
- Lastly, give your metric stream a name and hit Create metric stream.
That’s it! Without writing a single line of code, we configured an integration with AWS and Logz.io that enables fast and easy infrastructure monitoring through Amazon CloudWatch data collection.
Your metrics will be stored in Logz.io for 18 months out of the box, without requiring any overhead management.
You can also begin to build dashboards and alerts to begin monitoring – like this Amazon EC2 monitoring dashboard below.

Conclusion
This post demonstrated how to configure an integration with AWS and Logz.io for efficient infrastructure monitoring through Amazon CloudWatch.
To learn more about building metrics dashboards in Logz.io, you can watch this video.
Currently, some users might find that they are sending more data than they really need, which can raise costs. In future versions of this integration, it will be easier to narrow down the metrics to reduce costs.
Want to try it yourself? Create a Logz.io account today, navigate to our infrastructure monitoring product, and start streaming metric data to Logz.io to start monitoring.
About the authors
Amos Etzion – Product Manager at Logz.io
Charlie Klein – Product Marketing Manager at Logz.io
Mark Kriaf – Partner Solutions Architect at AWS